
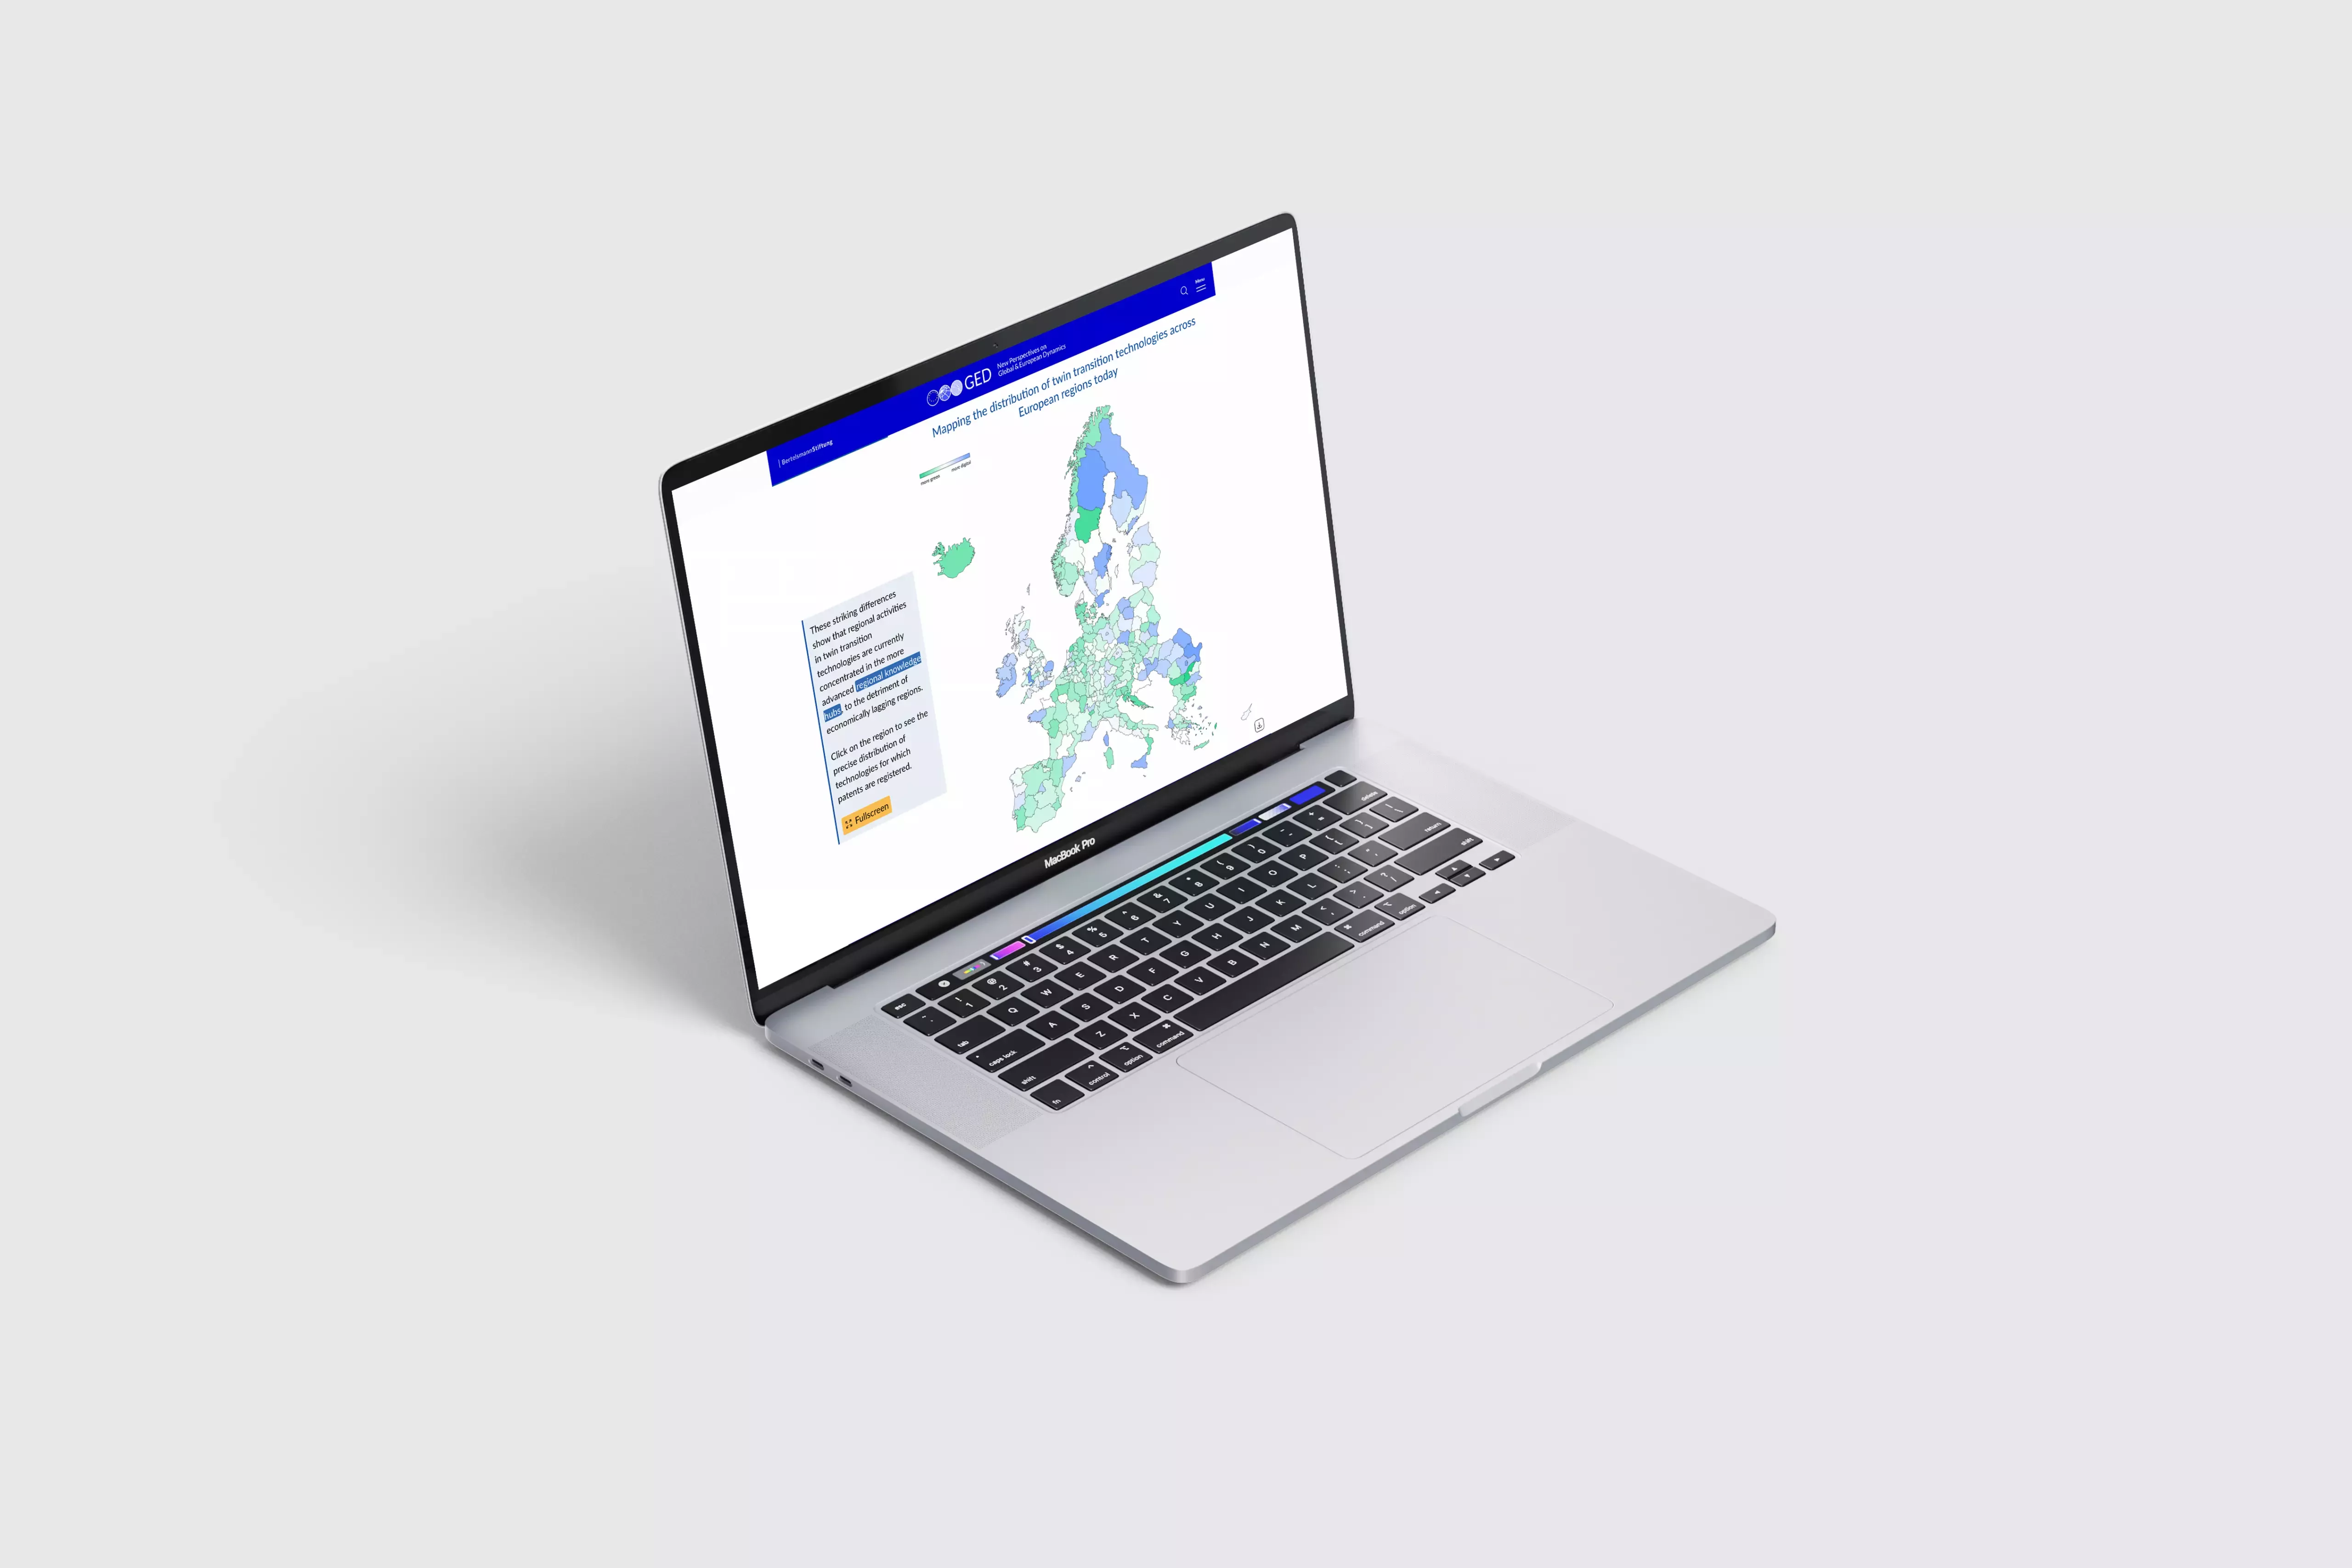
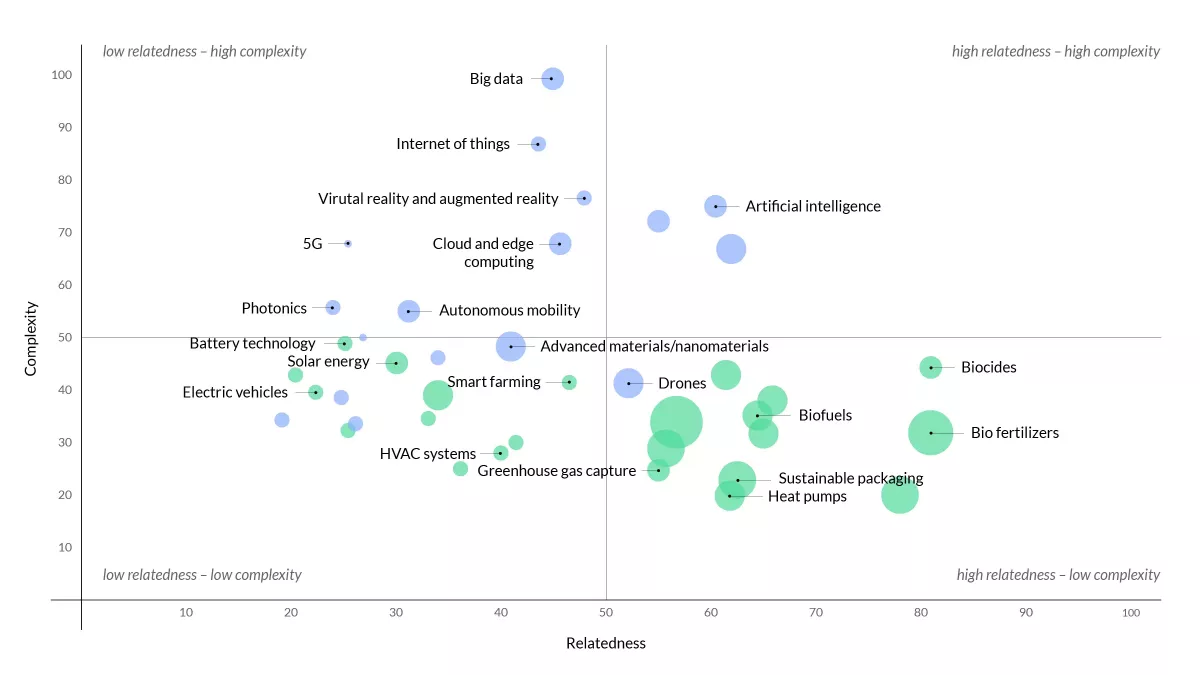
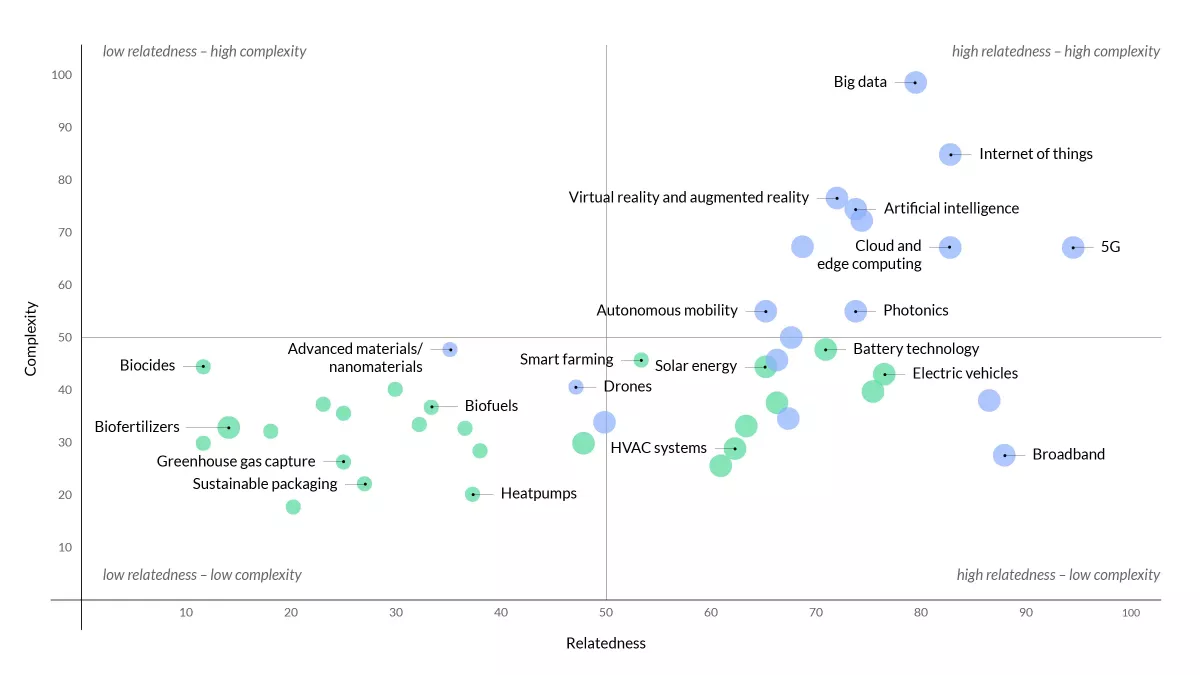
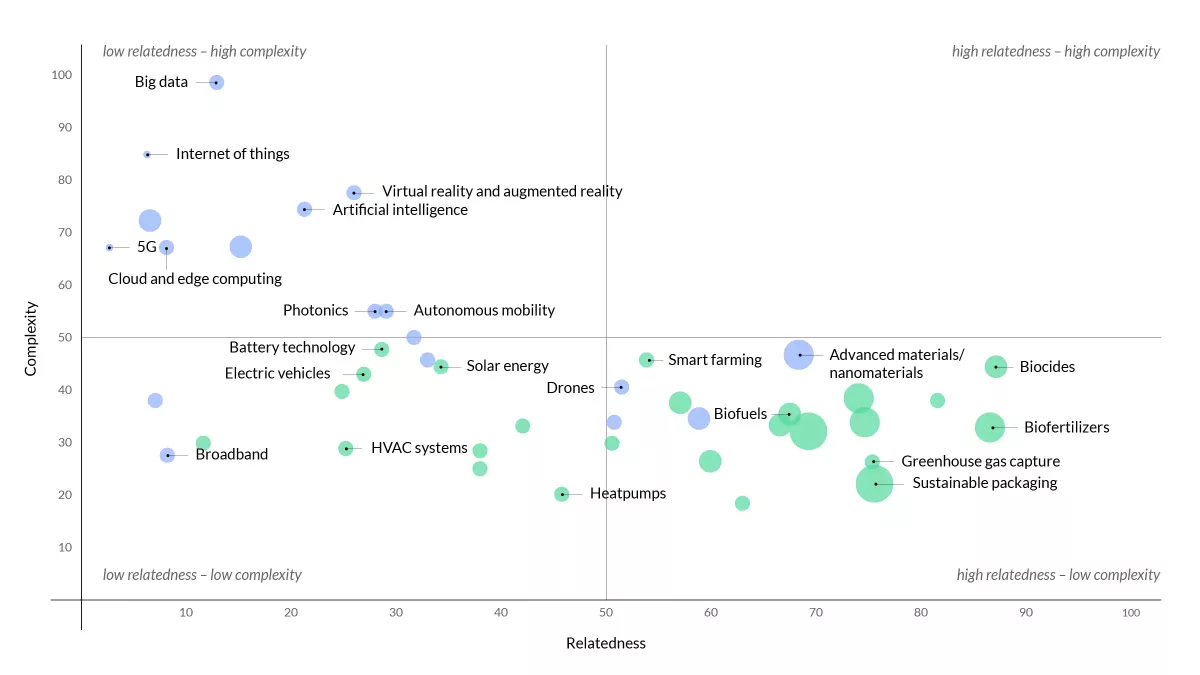
Infographics
The study results are presented clearly using interactive infographics. Heat maps show intensities, treemaps illustrate hierarchical structures, and the Smart Investment Graph visualizes variables such as market shares or relative advantages. The graphics are available both interactively on the website and statically in PDF format, creating a consistent information design.
Scrollable image gallery
User experience
The website was designed as a clear one-pager and is aimed at a broad audience. The scrollytelling approach guides users step by step through the content and makes the key findings of the study easily accessible. Clear navigation elements, intuitive interactions, and a minimalist design ensure that the content is conveyed in a comprehensible and appealing way.